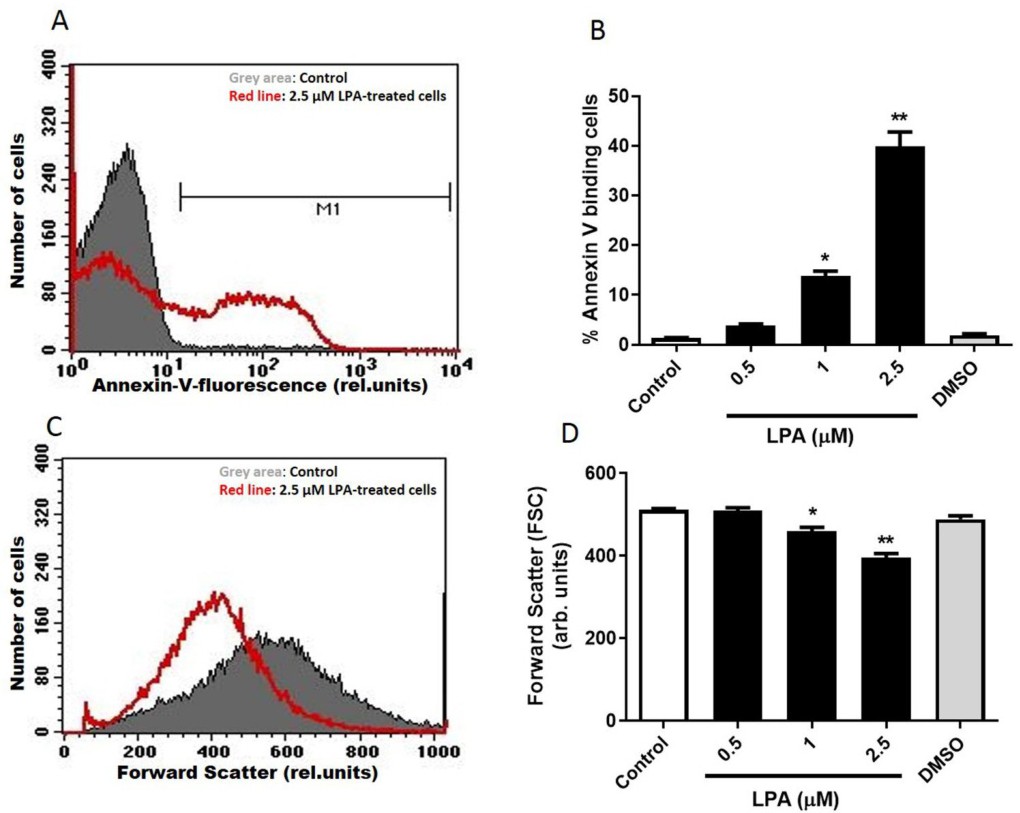
Fig. 1. Effect of LPA treatment on PS exposure and cell volume in RBC. Cells were treated in the presence of increasing concentrations of LPA. Original histogram of annexin-V-binding (A) and forward scatter (C) of RBC. Arithmetic means ± SEM (n = 8) of annexin-V-binding (B) and forward scatter (D) of RBC. Data are the means ± SEM (n = 8). Statistical significance was calculated by one-way ANOVA followed by Tukey's test. * (p<0.05) and ** (p<0.01) indicate a significant difference from cells lacking LPA treatment. For comparison, the effect of the solvent DMSO is shown (grey bar).